Log · Entry 03
The moving target
Relationships between variables in one’s life form, break and re-form. If Eudaemon finds that a change in one variable causes a change in another, how long does that finding hold true? To recap. Eudaemon turns a person’s records into evidence strong enough to act on, and turns the goals a person brings into questions that evidence can answer. Entry 02 showed that correlations between variables are limited to generating predictions, and that only causes generate prescriptions; hence the importance of causes, and how they might be uncovered from correlations by experiments where a coin decides. Entry 02 also introduced ρ, and the impact of that number on whether Eudaemon is more a watcher or an experimenter in the hunt for causes. This entry ties ρ, correlation and causation together to answer that question.
ρ: how much one night repeats the last
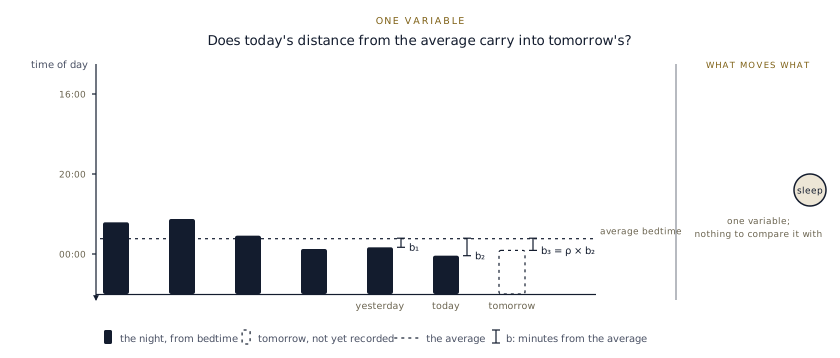
Each night’s bedtime sits some minutes from the average bedtime; call that b. ρ is the extent to which today’s minutes from the average (b₂) persist into tomorrow’s (b₃), taken over every pair of nights in the record. At ρ = 0 the nights vary freely and today tells you nothing about tomorrow beyond the average bedtime itself; at ρ = 1 tomorrow’s minutes are today’s again. For those who prefer an equation:
ρ = Σ(b₂ × b₁) ÷ Σ(b₂ × b₂)
summed over every pair of consecutive nights
The best guess for tomorrow’s bedtime, b₃, is then the average plus ρ × b₂, which is the dashed bar on the graph.
If ρ is high, the nights whose variation in bedtime could be attributed to something other than the night before are few, so the number of nights on which an independent cause could show itself is equally small. For high ρ, then, the record takes far longer to identify variables that influence bedtime independently of the night before, and Eudaemon must manufacture that independence with a coin flip experiment. Where ρ is low, Eudaemon can wait and watch.
r and β: how 2 variables move together
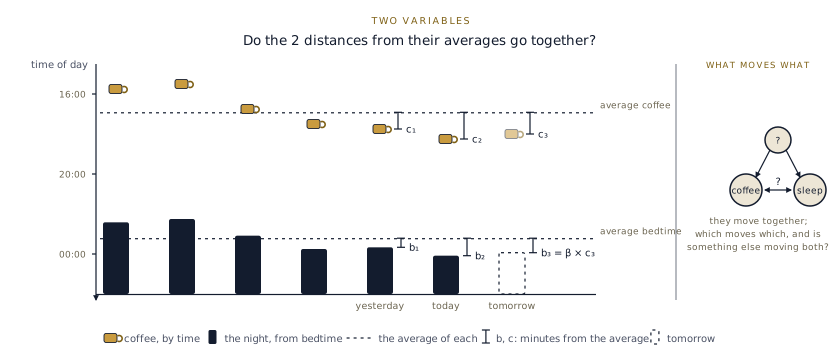
Now add a second variable on the same nights and the same axis: coffee, each cup placed by the time it was drunk, with its own average and its own minutes from it, c. r (correlation) is the extent to which one variable’s distance from its average co-occurs with the other’s, over every night in the record. r runs from 0 to 1 in strength, and on the graph the nights the coffee sits later than its average are the nights the bedtime sits later than its own, so this r would be strong, near 1. However, there’s another number which describes correlations: β.
β is the size of the effect the correlation describes: how many minutes later bedtime falls for each hour later the coffee. So an almost perfect r on a variable that barely moves gives a small β, and a loose r on a variable with a wide spread can give a large one. β is in the units a decision is made in, and it is the number this entry is about.
β = Σ(b × c) ÷ Σ(c × c)
summed over every night
A correlation warrants a prediction. If tomorrow’s coffee is planned an hour late, the record predicts a bedtime β minutes later than average; that is the dashed bar, b₃ = β × c₃, and it is the whole of what a watch engine can promise. What it can’t say is what to change, because the record can’t tell which way the link runs, or whether something else moves both.
The coin: which way the link runs
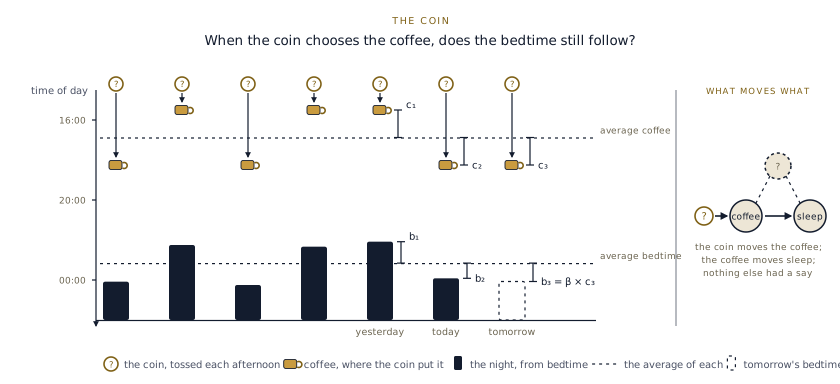
The purpose of the coin is to force variation in one variable independently of everything else. Each afternoon it dictates whether the coffee is early or late, and nothing else has a say. If the bedtime still runs late after the late coffees, the link runs from coffee to sleep: a poor night can’t have chosen the coffee, because the coin did, and nothing else can have moved both, because the coin consulted nothing. The direction is settled, as the right panel of the diagram shows.
The coin supplies the independence a high ρ withholds, settles the direction of r, and gives the answer in β’s units. Suppose it says late coffee puts bedtime back by 40 minutes, give or take 15, over the 8 weeks it ran. That is the kind of number a decision is made on: what to change to reach a goal, what a big choice would cost, what an agent may do on the user’s behalf. How long does it hold true?
Two clocks
β as calculated doesn’t hold forever. In the coffee example, caffeine tolerance may build, so β shrinks; or a baby arrives and dictates both the bedtime and the coffee, whatever the link between them was. There are 2 clocks: clock 1, how long β takes to calculate; and clock 2, how long it holds true.
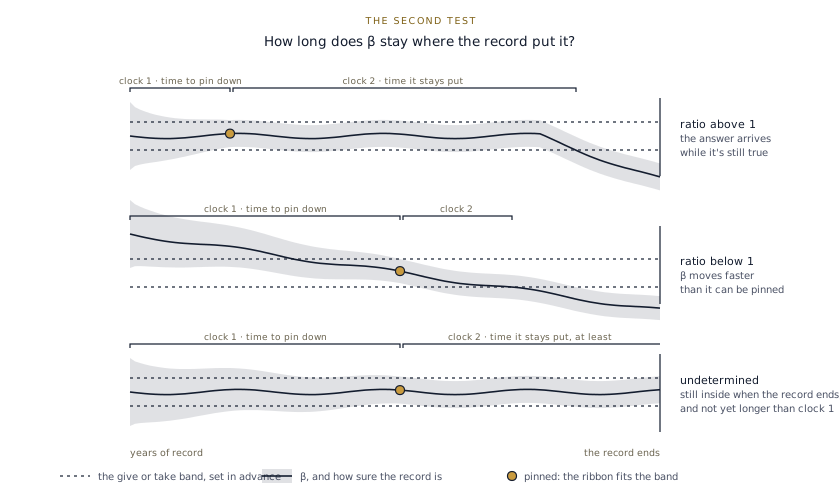
The test measures clock 2 by watching the archive: calculate β on one stretch of the record, with its give or take as a band around it. Measure β again on later stretches and record whether it remains within the band or has moved outside it. Where it has moved, the time it stayed put before moving is clock 2.
Importance to Eudaemon
Dividing clock 2 by clock 1 gives a ratio, and the test is how those ratios fall across every β the record can pin. Above 1, the answer arrives while it’s still true; the bigger the ratio, the longer β stays useful. Below 1, β has moved before it was known, and is of no use. A β still inside its band when the record ends has stayed put for at least that long, and where that isn’t yet longer than clock 1 the ratio is undetermined. β describes a relationship between 2 variables, and life has thousands of variables, so hundreds of thousands of βs. The more of those ratios sit above 1, the more useful Eudaemon is to that user: the record can establish things about them that stay true long enough to act on, and the build order stands. Mostly below 1, and the project contracts to the questions that settle quickly, plus a small annex of experiments.
This week’s files. The 4 figures in this entry, in light and dark · the QA run record.
Next. The next test on the list.